Creating reports is a two-phase process:
-
Prepare the data (done once per day-ish)
-
Create reports (can be done multiple times using the prepared data)
Think of this like prepping a kitchen. You prep once, then you can cook up multiple reports. This guide covers Phase 2: Creating Reports.
If you haven't done the first step yet, prep your kitchen before proceeding!
Once your data is fresh and you know which report you're doing, make sure you have the Client Ticket open in HubSpot. Familiarise yourself with what the project included, so you can spot any discrepancies while reporting.
PREP THE REPORT
IMPORTANT: Only 1 person can do these reports at a time, or it can mess with the data.
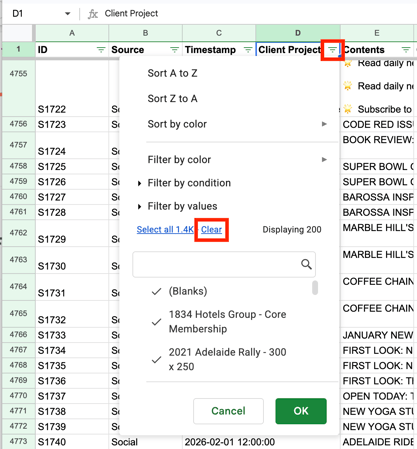
1. Filter the COMBO Tab by Client Project
Master Google Sheet (Glam Data):
https://docs.google.com/spreadsheets/d/1picHzy_LXatys1EZafkQDMkeuyPENlowy_lv0gdMiG4/edit?gid=351458795#gid=351458795
-
In the Master Google Sheet, open the COMBO tab.
-
In Column D (Client Project), toggle the filter off/on to reset it.
-
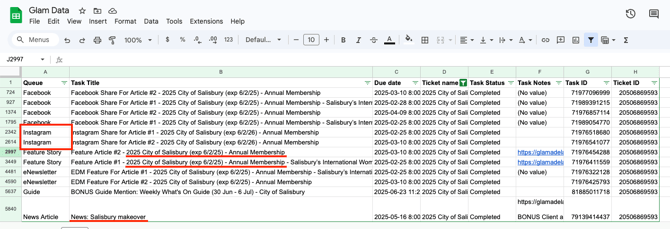
Click the green dropdown arrow beside the Client Project header. Click Clear to deselect all default options (see screenshot).
-
In the search bar, begin typing the name of the Client Project you want to report on. Select all relevant matching entries...
⚠️ Important context! This column combines:
1. Ticket Names (Tasks data)
2. Campaign Names (Socials data)
3. Advert Names (AdRotate data)
Most of the time, Ticket and Campaign names will match - but occasionally they will not. If there are discrepancies, select both.
Also check for related website advertising entries (e.g. MREC, Skyscraper, etc). Not every client project will include website advertising.
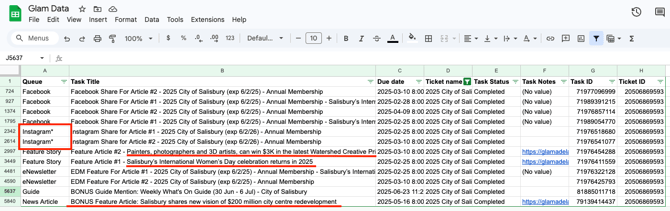
Example Selection
For example, to report on the project for Kitchen Warehouse, you would select all three of these in the filter:
-
2025 Kitchen Warehouse exp 30/07/26 - Annual Membership(Ticket name) -
2025 Kitchen Warehouse - Annual Membership(Campaign name) -
2025 Kitchen Warehouse MREC Website Advertising 600K Impressions(Website advert name)
What You Should See After Filtering
Once filtered, the COMBO tab will display in this order:
-
Relevant Task records
-
Relevant Social records
-
Relevant Advert records
This gives you a consolidated overview of everything delivered for the Client Project, in one place.
ADD MISSING ASSETS
How-To Manually Add Missing Deliverables (only come back to this if required!)
Sometimes you will realise mid-report that a deliverable was never logged (e.g. a calendar listing that was not created as a task, a bonus grid spot feature that didn't get logged, etc). If that happens, use the ADD tab instead of going back into HubSpot, logging the missing deliverables, and going through the whole process of re-exporting everything.
NOTE: DOESN'T CURRENTLY WORK PROPERLY FOR ARTICLES. Go to the TASKS tab instead and add extra rows there.
How To Use the ADD Tab
-
In the Master Google Sheet, go to the ADD tab.
-
In cell A1, select the relevant Ticket Name from the dropdown.
-
In the Column A cells below A1, select the asset type(s) you want to add. Choose one type per row.
-
In Column B, enter a quantity beside each asset (eg: Calendar Listing | 3 ). The columns to the right in the sheet will populate automatically based on your inputs (see screenshot).
⚠️ IMPORTANT:
Never edit the grey columns! These are formula-driven.
Specifically, do not touch Columns C, D, F, H, I, and J.
Only edit the white columns if additional information is required.
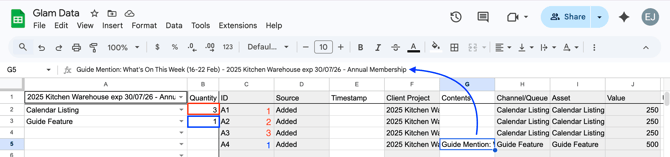
The Contents column is the description of the asset: aka the Task Title, or the Social Post Content, or the Advert Name (depending on the kind of asset you are adding). Use the same naming conventions you would use for any other asset of its kind (as shown with the blue arrow in the screenshot above).
Think of this tab as a manual override system. It allows you to add missing deliverables without redoing the entire export process.
Refresh the COMBO View
After adding new/missing assets via the ADD tab, you will need to return to the COMBO tab.
-
Open the filter dropdown again, and click OK to refresh.
Your additional assets will now appear at the bottom of the filtered results.
BUILD THE REPORT
Once your COMBO tab is correctly filtered, go to the Report Helper tab. This tab of the spreadsheet contains copy/paste-ready values that will help to streamline report creation.
⚠️ Important:
If no filters are applied to the COMBO tab, the Report Helper tab will appear blank. It only populates when the source data is filtered.
3. Create a New Looker Studio Report
With the Report Helper tab open in the spreadsheet:
-
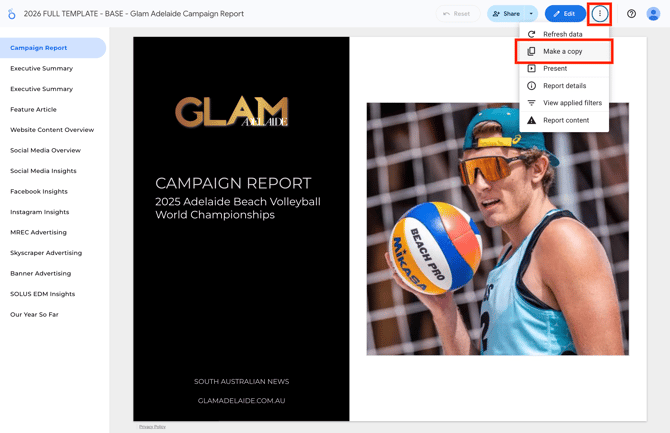
Open a new browser tab and go to Looker Studio. Use the search bar to find the most recent report template, and open it.
As of current writing, the only up-to-date template is: 2026 FULL TEMPLATE - BASE - Glam Adelaide Campaign Report which can be found here:
https://lookerstudio.google.com/u/0/reporting/9803a63c-ab6b-4952-ac53-e0b4c5e4cb27/page/p_5opi93tjid
-
A pop up titled Copy this report will appear. Click the Copy Report button and a cloned copy of the base template will open in a new tab.
-
Rename the file, keeping only the suffix:
- Glam Adelaide Campaign Report
Example:2025 Kitchen Warehouse Annual Membership - Glam Adelaide Campaign Report
4. Set Global Report Filters
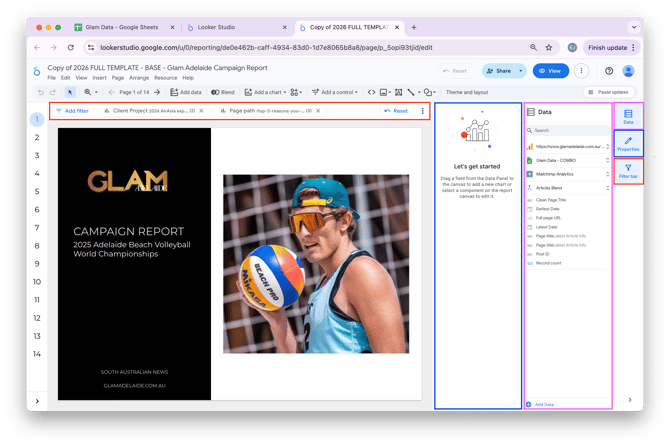
FILTER ONE: Client Project Filter (Global)
Along the right of the screen, three buttons toggle different panels in the view. The Filter Bar (red), the Properties Sidebar (blue) and the Data Sidebar (pink).
-
Ensure the Filter Bar (red) is visible along the top. Click the Client Project filter in the bar to select it.
-
Make sure the Properties Sidebar is open on the right of the window (blue). It can be toggled using the button on the right (blue). This will show details about the selected filter.
-
In the Properties Sidebar, select the Setup tab, then find the Default selection textbox (see screenshot). Remove any existing contents.
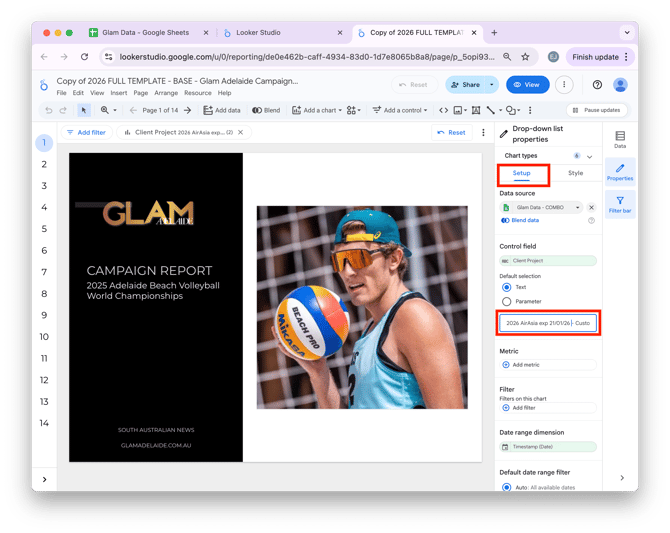
-
Return to the Master Google Sheet's Report Helper tab and copy the contents of cell A2 (the one labelled “Client Project Filter”).
- Paste this text into the Default selection textbox indicated in the screenshot above
- Deselect the Client Project filter by clicking away onto the grey background that surrounds the report page. You'll know you've properly deselected the filter if the Properties Sidebar returns to saying "Let's get started'.
FILTER TWO: Page Path Filter (Global)
-
In the Filter Bar along the top, click the Page path filter.
-
Ensure the Properties Sidebar is open and the Setup tab is selected.
-
Find the Default selection textbox. Remove any existing contents.
-
Return to the Master Google Sheet's Report Helper tab and copy the contents of cell B2 (the one labelled “Page Paths Filter”).
-
Paste this into the Default selection textbox, then click away onto the grey background surrounding the page to deselect the filter.
Your report will now be filtered to only calculate stats based on the correct records (data from COMBO sheet), and relevant Article URLs (data from Google Analytics).
EDIT OPENING PAGES
Title Page
-
Rename the title page subheading to match the client campaign.
Example:2025 Kitchen Warehouse Annual Membership -
Replace the placeholder photo: Select the existing image on the Title Page. Then in the Properties panel → Setup tab → click Image File. Upload your new image here, then adjust image positioning as needed.
-
Photo should be square and centred in the whitespace.
- To locate an appropriate photo, go to our WordPress Media Library and search the name of the client. Otherwise, Google them.
- Try not to use images that are too out of date (eg, old logo, was taken before new construction took place, etc.)
-
Pro Tip: Navigate to another page in the report, then return to it after a moment to confirm Looker Studio has replaced the image correctly.
-
-
Expand the Page Index sidebar using the arrow in the bottom left of the screen (see screenshot) for easier navigation.

Executive Summary Page
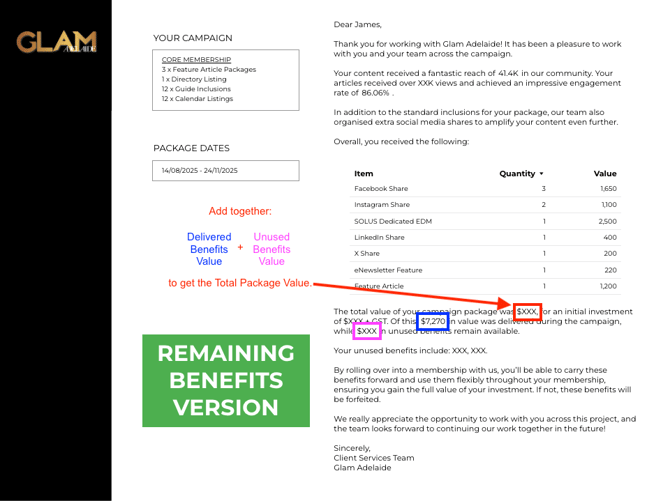
There are two versions of this next page: Standard campaign version, OR, Rollover/Unused benefits version. If the client did not use all the purchased benefits as listed in their Proposify contract, use the Remaining Benefits version of the summary page.
-
Choose the relevant page version for this client. This is the page you will keep.
-
Delete the unnecessary page via: Page > Delete Page (see screenshot) then give Looker Studio a minute to recalibrate (it will shunt you to an adjacent page).

Update Executive Summary Content
On the remaining Executive Summary page:
-
Update the addressee to the name of the primary contact listed on the client's Ticket.
Example:Dear Maggie,→Dear Emma,etc. -
Rewrite the YOUR CAMPAIGN box to reflect the client contract. You're usually safe to copy from the Ticket Description textfield in HubSpot, but always double-check against the Budget page in Proposify.
-
Update the PACKAGE DATES box using the details from the Hubspot Ticket's Create Date and Expiry Date fields.
-
Delete the coloured box specifying which version of the Executive Summary it is.
-
Leave this page partially incomplete for now (you will return to it later).
EDIT ARTICLE PAGES
Feature Article #1 Page
This page must be duplicated for every Feature and Bonus Article included in the package. The order in which each of the articles should be included is:
-
Feature articles first, numbered sequentially (#1, #2, #3, etc).
-
Bonus articles next, listed in publication order (oldest to newest).
Change the heading on each bonus article page to: BONUS FEATURE ARTICLE or BONUS FEATURE ARTICLE #1, #2, etc.
Example inclusion order for Feature Article pages:
FEATURE ARTICLE #1FEATURE ARTICLE #2FEATURE ARTICLE #3BONUS FEATURE ARTICLE #1... (was published 01/01/26)BONUS FEATURE ARTICLE #2... (was published 08/08/26)
Apply Filter: Article-Specific Page Path
So far, within the entire report we have narrowed the data down from all articles, to only those that are relevant for the client. Now, each Article Page requires an additional filter to narrow down the data, so it only includes one article at a time. We do this with an additional filter that applies to just one page, rather than the whole report at once (like our global filters).
-
Ensure the Filter Bar is open. On an Article Page, you should now see three filters in the bar as opposed to the usual two we set earlier.
-
Click the third filter (confusingly it is also called “Page path”, but this time it will contain only one page path).
-
Ensure the Properties Sidebar is open, and go to the Setup tab. Scroll to the Default selection textbox and remove any existing contents.
-
Return to the Master Sheet and copy the singular (1) relevant page path url. All these individual page paths will all listed in cells from A5 onward. Bonus and feature article links will be mixed together here, so make sure you are copying the correct page path.
-
Paste your singular (1) page path into the Default selection textbox.
Now, all article-specific statistics used on the Feature Article page should now auto-populate!
If statistics are not populating:
-
Double-check the formatting of the page path text you copied into the Default selection textbox. make sure there is a leading slash / at the front and no comma , at the end.
-
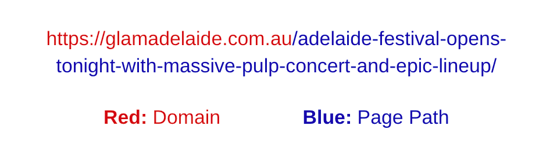
Compare to the live article URL (Occasionally, but rarely, an article URL may change). You can grab the page path directly from the live article URL if needed. A page path is everything that comes AFTER the "https://glamadelaide.com.au" (see screenshot).
Replace Article Screenshot & Headline
-
On the Article Page in Looker Studio, there is a vertical box on the right of the page and in it is an item labeled Article Link. Click the Glam URL beneath to open the live article.
-
Copy the article headline and paste it into the FEATURE ARTICLE HEADLINE text box back in Looker Studio.
-
Next, arrange your browser window for a clean screenshot:
-
Do NOT include the Wordpress User Menu Bar.
-
Ensure the logged-in greeting in your Wordpress User Menu Bar is not overlapping the site header (see screenshot). If it is, make your browser window wider until there is no more overlap.
-

-
-
Extend your screenshot down to the bottom of the feature image. Optionally, you can include the row of social share buttons if it makes the screenshot fit better.
-

-
Back in Looker Studio, select the existing screenshot on the Article Page.
-
In the Properties panel → Setup tab → click Image File. Upload your new screenshot here, then adjust image positioning as needed.
-
Pro Tip: Navigate to another page in the report, then return to it after a moment to confirm Looker Studio has replaced the image correctly.
Duplicate the Feature Article Page and Repeat for All Additional Articles
-
To create additional Article Pages, in Looker Studio go to Page > Duplicate Page.
-
Repeat these filtering and screenshot steps for each feature article and bonus article.
Website Content Overview Page
For this page, you might delete it entirely, just delete the first section titled 'Article & Guide Overview', or use all sections. Follow these steps to decide what to do with the page:
Step 1: Check how many articles are included in the package.
-
If the package includes more than one article, keep the page and move to Step 3.
-
If the package includes only one article, move to Step 2.
Step 2: Check how many guides the client appeared in.
Delete the entire page if:
-
the client appeared in zero guides, OR
-
the client appeared in less than 3 of our standard weekly/monthly What’s On guides.
If the client project meets this criteria (i.e. it’s a single article package and only appeared in 2 standard 'What’s On' guides) then delete the page. The guide inclusions will still be counted towards the client's total delivered assets, but the lack of new information just makes this page redundant.
Step 3: Decide whether to delete the first section only.
Delete the first section of the page if:
-
the client appeared in zero guides
If the client project meets this criteria (i.e. it’s a core membership with 3 articles, but they didn't appear in ANY guides) then delete the first section titled 'Article & Guide Overview'.
NOTE: When highliting items on the page to delete, DO NOT delete the blank white box at the top of the page. It will outline in purple when selected, that means it needs to stay.
You should now have one of the following layouts:
- No Website Content Overview page
- A Website Content Overview page with one section, titled 'Total Website Traffic'
- A Website Content Overview page with two sections, titled 'Article & Guide Overview' and 'Total Website Traffic'
If you have Layout 2 or 3, proceed with these steps:
- Sometimes the 'Total Website Traffic' numbers are faulty, you may need to do some math to correct them.
- You will find a whiteout correction textbox already exists over the 'Website Views' number.
- Move the whiteout textbox off the page if it is not needed.
- Don't delete the textbox, because there may be something you have to whiteout later, and this text box already has all the correct settings to copy-paste.
- You will also see a series of smaller whiteout boxes that can be dragged over any faulty numbers in the table as well, if needed.
- If you are correcting faulty website views:
- You must ALSO correct the 'Engaged Sessions' number. Find the correct value by doing the following calculation:
[Website Views] * [Engagement Rate %] = [Engaged Sessions]
Round to the nearest whole number.
- You must ALSO correct the 'Engaged Sessions' number. Find the correct value by doing the following calculation:
If you have Layout 2, proceed with these steps:
- Move the 'Total Website Traffic' section to the top of the page.
- Open any of article included in the package that had good photos in it. Scroll down a bit and grab a screenshot of a photo along with some text above or below the photo. Repeat this with a second screenshot if needed.
- Insert the screenshot(s) to fill the empty space on the page beneath the 'Total Website Traffic' section. Remember to go to Properties sidebar -> Style tab and give your screenshots the correct coloured outline (the grey above the green).
If you have Layout 3, proceed with these steps:
- Rearrange the 'Article & Guide Overview' section and the 'Total Website Traffic' section to be well balanced on the page (not too much empty whitespace).
- Make sure all items in the 'Article & Guide Overview' list are named correctly (eg no missing article headlines, all consistent formatting, all guide mentions start with "Guide Mention" etc.)
- If you need to edit these, this can be done on the TASKS tab of the Master Sheet.
- Filter the TASKS tab by the 'Ticket Name' column to only see your client's ticket. Here you'll see all relevant tasks logged for the client's Articles and Guides.
- Rename the task names in the 'Task Title' column. When you're done, head back to Looker Studio and refresh the data to update the page.
EDIT SOCIALS PAGES
Social Media & Paid Promotions Page
Ahh, my favourite page. It should sort itself out pretty easily! Just scan over and do a quick sense check to make sure the data is coming through properly:
- If there were 3 feature articles in the client's package (each with 3 Facebook, 1 Instagram, 1 X/Twitter, and 1 LinkedIn = 6 social posts), then does the 'Total Posts' number equal at least 18?
- Does the 'Contents' column of the list look like the topics we posted about are relevant to the topics the client had us writing/promoting?
- Does anything else look wildly out of place?
If the 'Impressions' column starts showing numbers below approx 1 thousand, we should:
- Click on the list, and adjust the size of the lowest edge, dragging it upward to conceal the lower numbers.
- Re-space the contents of the page to be more visually balanced.
Social Media Insights (Facebook)
Another great easy page. Scan over the contents quickly and sense check to make sure the data is coming through properly.
- Does the 'Total Posts' number make sense with the table below it? The table will only show the top 8 posts.
- Does the 'Published Message' column look like the topics we posted about are relevant to the topics the client had us writing/promoting?
The only thing left to do here is replace the screenshot:
- Click the 'Published URL' of the top performing post in the table. It will open in a new tab.
- Take a screenshot of the post. Do not include the FB header above, do not include the FB interaction stats below (see screenshot).
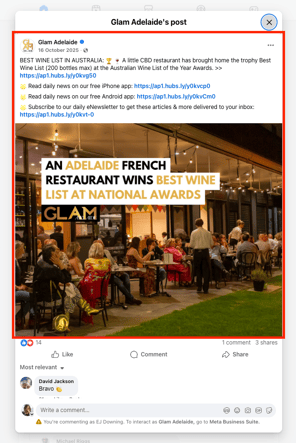
- Head back to LookerStudio and select the placeholder image. In the Properties panel → Setup tab → click Image File. Upload your new screenshot here, then adjust image positioning on the page as needed.
Social Media Insights (Instagram)
Same deal as the Facebook page. Scan over the contents quickly and sense check to make sure the data is coming through properly.
- Does the 'Total Posts' number make sense with the table below it?
- Does the 'Published Message' column look like the topics we posted about are relevant to the topics the client had us writing/promoting?
The only thing left to do here is replace the screenshot:
- Click the 'Published URL' of the top performing post in the table. It will open in a new tab.
- Take a screenshot of the post (see screenshot).
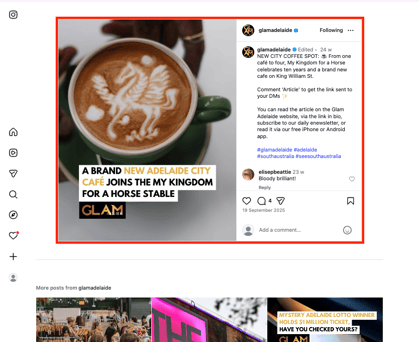
- Head back to LookerStudio and select the placeholder image. In the Properties panel → Setup tab → click Image File. Upload your new screenshot here, then adjust image positioning on the page as needed.
INSTAGRAM WARNING: Below is a very important note about how to get Instagram assets show up correctly in reporting. First is an explanation, then there are instructions.
EXPLANATION
Because we log the socials as tasks on the Ticket and also they're logged in the socials tool when the posts are actually made, the COMBO page has been set to "ignore" socials tasks, so that our socials posts don't get counted twice (once on the TASKS tab and again on the SOCIALS tab).
However! IG Reels and IG Stories do not go through the socials tool (thanks Instagram ![]() ) so from a reporting stance, those only exist on the TASKS tab. Because of this, we cannot allow the COMBO tab to "ignore" all the Instagram tasks, because reels and stories would be missed. Better to have things counted twice than not at all, so at least we can see when something is amiss.
) so from a reporting stance, those only exist on the TASKS tab. Because of this, we cannot allow the COMBO tab to "ignore" all the Instagram tasks, because reels and stories would be missed. Better to have things counted twice than not at all, so at least we can see when something is amiss.
Separate to this, in early 2025 we swapped from selling IG Stories for each article to selling IG Shares for each article. If an article was published in early 2025 or before, it's likely there will be NO record of Instagram posts related to the article. However there WILL be Tasks for IG Stories (for reasons that aren't important, some of these may be called 'Instagram Shares' anyway, just rename them.
TL;DR: At the moment, Instagram posts quite often gets counted twice. This is a problem! Until I can fix it up, these are my trouble shooting steps...
INSTRUCTIONS
We'll have to work in the Master Sheet to fix the data at the source. Start in the TASKS tab:
- Filter the TASKS tab by the 'Ticket Name' column to only see the tasks logged to your client's ticket. You will see something like the following example.
- We are focusing on the Instagram tasks right now, but while we're here, we can see that the Feature Article tasks (#1, #2, and BONUS) need to be renamed too.
- For the two Instagram tasks, we can make the COMBO page "ignore" them by placing an asterisk * at the end of the 'Instagram' queue name (see screenshot). We can also rename those Feature Article tasks properly while we're here.
EDIT ADVERTISING PAGES
MREC
If they have any ads, they should autofill on the page. @EJ - this is a little different when they have more than 1x MREC Ad.
Head to Wordpress > AdRotatePro > Manage Adverts > Search the Ad > Open stats > Also open the main link/title > Download the image of the MREC > Paste into the page.
Replace the stats graph
Fix up the dates Screengrab the graph and input into the page.
Fix up the title of the graph
EDIT ADDITIONAL PAGES
(To be completed)
Stats So Far (Conclusion Page)
Only one number to change on this page (see screenshot).
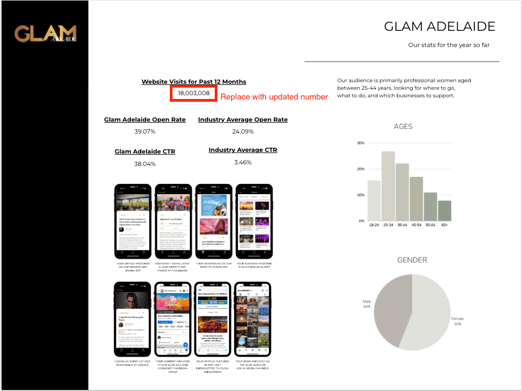
To get the updated stats, go to this Looker Studio report called STATS UPDADE: https://lookerstudio.google.com/u/0/reporting/6bc20854-94a1-4fe8-92ad-0b4eeed81593/page/p_5opi93tjid
Copy paste the updated value from the STATS UPDADE report into your client report.
RETURN TO EXECUTIVE SUMMARY PAGE
At the end of the process, we've found any missing assets and chased down every stat. It's now time to return to the Executive Summary and fill in all the missing figures here.
- Read over the table. Do the inclusions and quantities line up with everything you know about the client project?
- If there are double the Instagram posts you thought there were, head back to the Master Sheet TASKS tab and asterisk * the Instagram tasks.
- If items are missing (eg Calendar Listings, eNewsletter Features, Grid Spots, etc), head back to the Master Sheet ADD tab and use it to add the missing assets.
STANDARD VERSION
- If the Global Filter for the Client Project has more than one option included in it, the auto-calculated total value in the body text will not work. To calculate the actual total:
- Take a screenshot of the table's Value column
- Open ChatGPT, give it the screenshot and tell it to "sum these values".
- Replace the auto calculated total value with the actual total value (see screenshot).
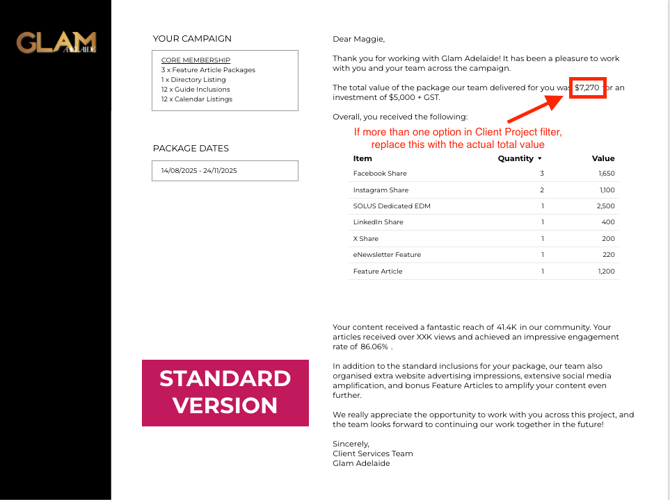
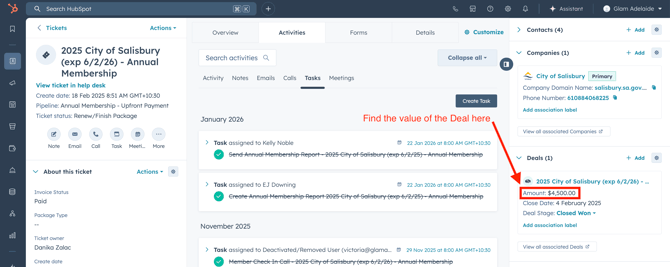
- The total investment number (template value is '$5,000 + GST') must be replaced with how much the client actually paid for the project. This number can be found in HubSpot from the client's Ticket, which will have a Deal record linked on the right side.
- Find the 'Amount' value of the Deal (see screenshot), and update the total investment number, making sure to keep '+ GST'.
- The total views number (template value is 'XXK') must be replaced with the actual total views their articles received. This total is be found on the 'Website Content Overview' page.
- If the 'Website Content Overview' page has been deleted, there is only one article. In which case, the preceding sentence in the textbox must be updated to remove reference to multiple articles (ie articles -> article).
- The additional assets paragraph needs to be edited to reflect the actual bonus assets that were delivered to the client. Examples can include:
- In addition to the standard inclusions for your package, our team also organised extensive social media amplification to boost your content even further.
-
- In addition to the standard inclusions for your package, our team also organised extra website advertising impressions, extensive social media amplification, and bonus Feature Articles to amplify your content even further.
- Check to make sure the textboxes and the table are arranged to look balanced on the page.
- Click on File -> Download as -> PDF. It will take its sweet time to download.
REMAINING BENEFITS VERSION
- The total views number (template value is 'XXK') must be replaced with the actual total views their articles received. This total is be found on the 'Website Content Overview' page.
- If the 'Website Content Overview' page has been deleted, there is only one article. In which case, the preceding sentence in the textbox must be updated to remove reference to multiple articles (ie articles -> article).
- The additional assets paragraph needs to be edited to reflect the actual bonus assets that were delivered to the client. Examples can include:
- In addition to the standard inclusions for your package, our team also organised extensive social media amplification to boost your content even further.
- In addition to the standard inclusions for your package, our team also organised extra website advertising impressions, extensive social media amplification, and bonus Feature Articles to amplify your content even further.
- If the Global Filter for the Client Project has more than one option included in it, the auto-calculated total value in the body text will not work. To calculate the actual total:
- Take a screenshot of the table's Value column
- Open ChatGPT, give it the screenshot and tell it to "sum these values".
- Replace the auto calculated total value with the actual total value (see screenshot).
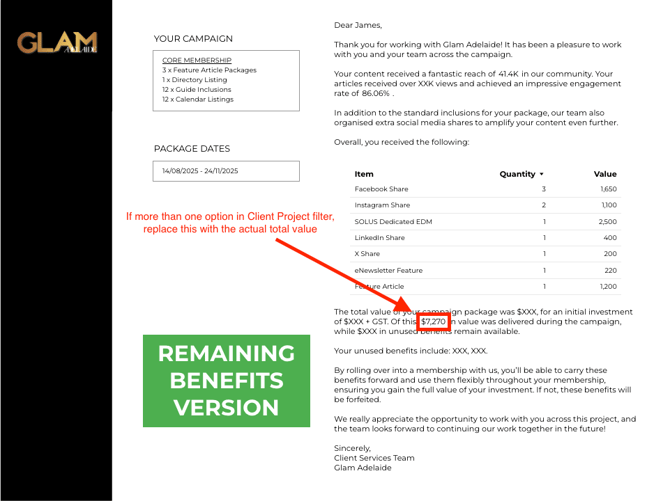
- The total investment number (template value is '$XXX + GST') must be replaced with how much the client actually paid for the project. This number can be found in HubSpot from the client's Ticket, which will have a Deal record linked on the right side.
-
- Find the 'Amount' value of the Deal (see screenshot), and update the total investment number, making sure to keep '+ GST'.
- Identify remaining benefits, and calculate their value (see screenshot).
- This will only include assets the client paid for which were NOT delivered.
- For memberships, DO NOT include unused Guide Inclusions or Calendar Listings. These have not technically been purchased, but were offered for 'free' as a perk of being a member with us.
- List the unused benefits in place of the 'XXX, XXX.' Use the same text formatting as inthe 'YOUR CAMPAIGN' box, but instead of one asset per line, make them comma separated:
- Eg: 1 x Feature Article Package, 2 x Instagram reels, 100K x Website MREC Ad Impressions.
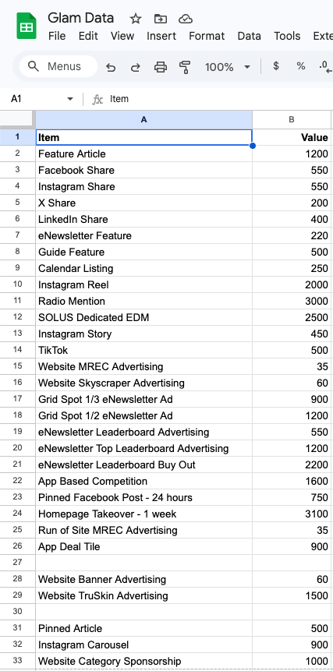
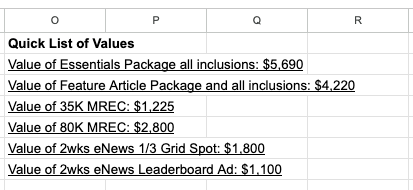
- Calculate the value of all unused benefits. NOTE: The value of assets is DIFFERENT to the retail price. We may sell a single article package for $2,500, but the actual value of all inclusions is $4,220.
- To calculate the value of remaining inclusions, refer to prices in the VALUES tab of the Master Sheet (you'll have to do some maths). See screenshot for reference.
-
- I have started a quick list of frequently used values for reference. This can be found on the right in Column O of the VALUES tab (see screenshot).
- Put your calculated value for all unused benefits in place of the '$XXX' pictured above.
- The total package value number can be calculated as follows:
[Delivered Benefits Value] + [Unused Benefits Value] = [Total Package Value]
- Check to make sure the textboxes and the table are arranged to look balanced on the page.
- Click on File -> Download as -> PDF. It will take its sweet time to download.